Your Unique Voice Print
What does it your voice look like?
When I record your voice, I am accurately measuring the emotions, frequencies and tone in your voice. When you talk about different things, these subtle tones are sorted into musical notes displayed as numbers and also as a coloured bar graph like this one.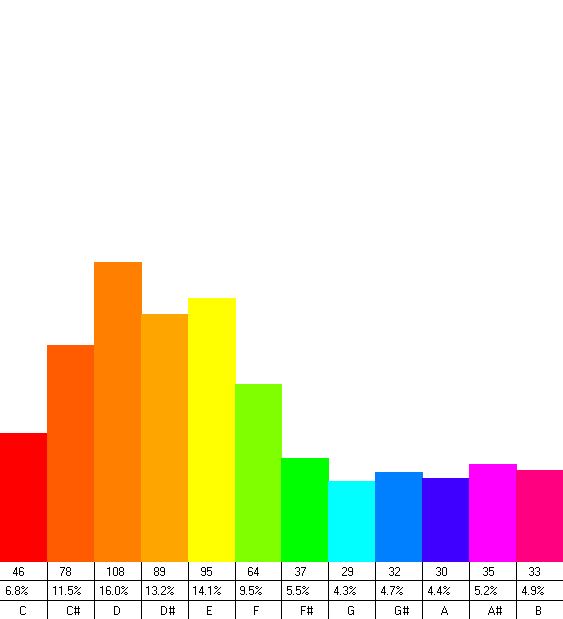
You can see the imbalances between the notes of D which is the highest, and G through to B (lowest)
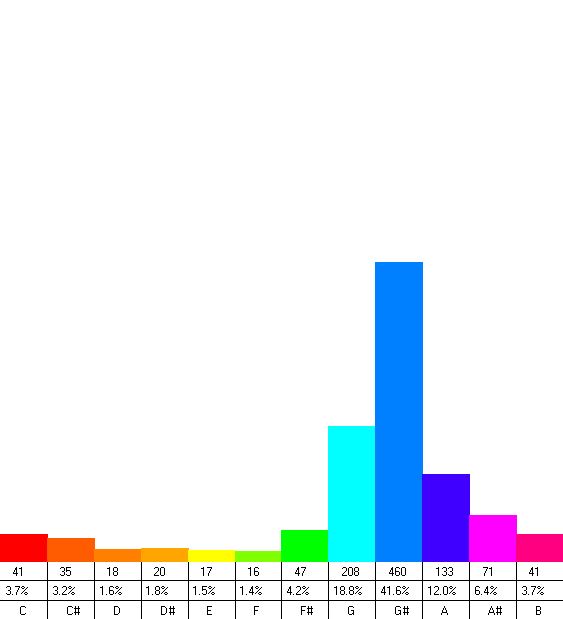
In general terms, this means that the vocal tones are more concentrated around C# to F, with little energy in the voice around G through to B. A voice can also look like this next one – which is virtually the opposite pattern.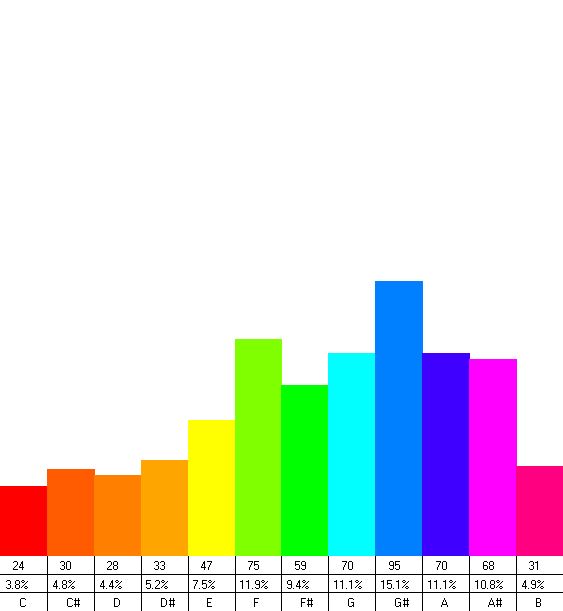
Perhaps the most important point in this voice is the lack of any real vocal tone in the note of B/C through to E. This indicates that there could be a possible problem with digestion. Click here to see a chart of notes and their meanings.
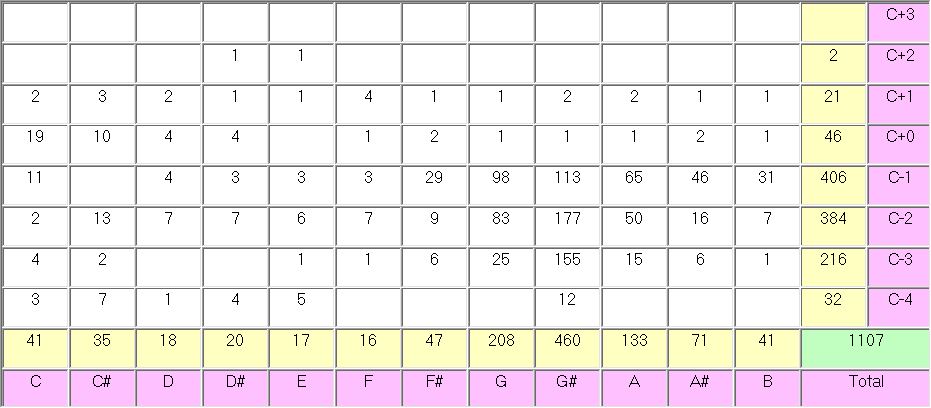
In Numbers, it can look like this: This is how I can analyse and discover where the issue is and what caused it.
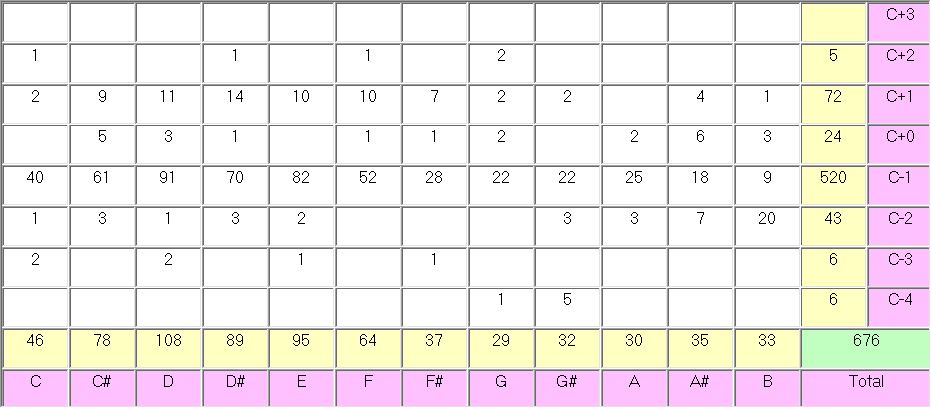
Or – like this last one below. So you can see a small
sample of just how different voices can be!